Search images...
Custom work
All
Photos
Illustrations
Designs
Collections
Contributors
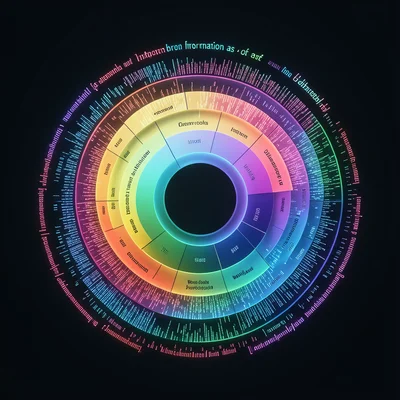
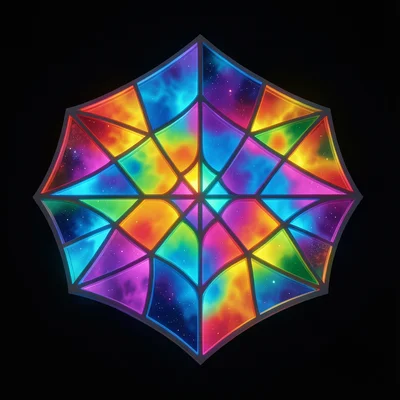
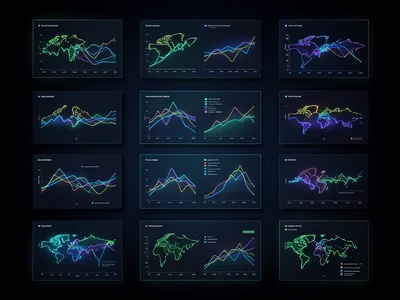
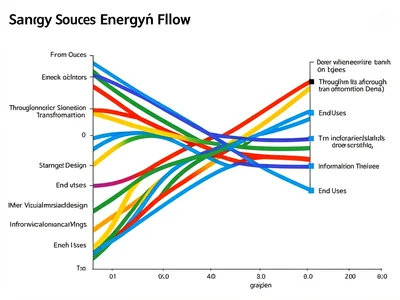
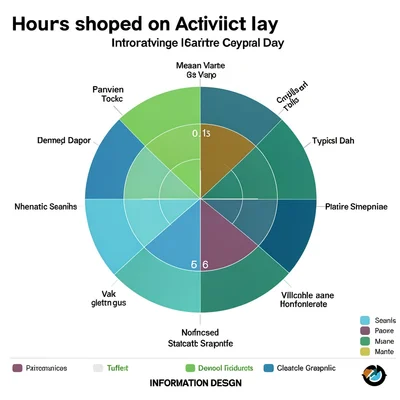
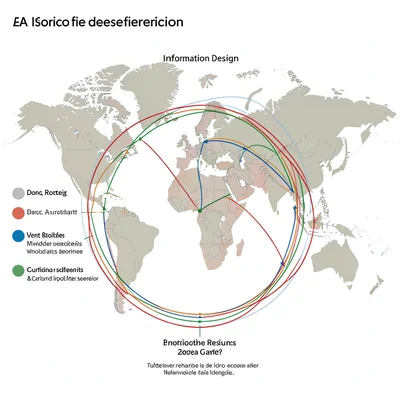
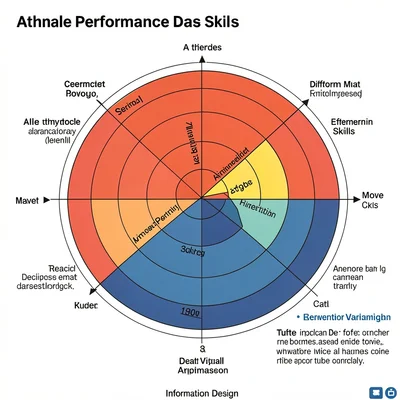
data visualization
Orientation
Color
Exclude
Features
Sort by
pattern
sacred
technology
art
abstract
kolam
+4 more
circuit
india
geometry
light
Devi Neon
Download
Kai Weber
Download
Datum Moreau
Download
Datum Moreau
Download
Datum Moreau
Download
Luna Voss
Download
Datum Moreau
Download
Priya Databend
Download
Priya Databend
Download
Priya Databend
Download
Datum Moreau
Download
Kolam Circuit
Download
Kolam Circuit
Download
Kai Weber
Download
Kolam Circuit
Download
Kai Weber
Download
Priya Databend
Download
Priya Databend
Download
Datum Moreau
Download
Datum Moreau
Download
Datum Moreau
Download
Datum Moreau
Download
Datum Moreau
Download
Datum Moreau
Download
Datum Moreau
Download
Datum Moreau
Download
Datum Moreau
Download
Datum Moreau
Download
Datum Moreau
Download
Datum Moreau
Download
Datum Moreau
Download
Datum Moreau
Download
Datum Moreau
Download
Chart Visualson
Download
Chart Visualson
Download
Chart Visualson
Download
Chart Visualson
Download
Chart Visualson
Download
Chart Visualson
Download
Chart Visualson
Download
Chart Visualson
Download
Chart Visualson
Download
Chart Visualson
Download
Chart Visualson
Download
Chart Visualson
Download
Chart Visualson
Download
Chart Visualson
Download
Chart Visualson
Download
Chart Visualson
Download
Chart Visualson
Download
Chart Visualson
Download
Chart Visualson
Download
Chart Visualson
Download
Priya Databend
Download
Hex Malachite
Download
Nyx Datacenter
Download
Isobar Stitch
Download
Kolam Circuit
Download
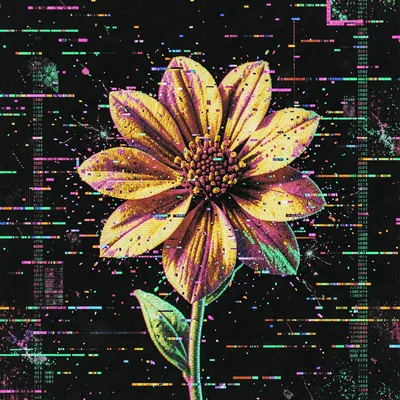
Glitch Nullström
Download
Glitch Nullström
Download
Luna Voss
Download
Luna Voss
Download
Isobar Stitch
Download
Isobar Stitch
Download
Kai Weber
Download
Priya Databend
Download
Tomás Lindgren
Download
Priya Databend
Download
Priya Databend
Download
Priya Databend
Download
Priya Databend
Download
Priya Databend
Download
Priya Databend
Download
Priya Databend
Download
Priya Databend
Download
Priya Databend
Download
Priya Databend
Download
Priya Databend
Download
Priya Databend
Download
Priya Databend
Download
Devi Neon
Kai Weber
Datum Moreau
Datum Moreau
Datum Moreau
Luna Voss
Datum Moreau
Priya Databend
Priya Databend
Priya Databend
Datum Moreau
Kolam Circuit
Kolam Circuit
Kai Weber
Kolam Circuit
Kai Weber
Priya Databend
Priya Databend
Datum Moreau
Datum Moreau
Datum Moreau
Datum Moreau
Datum Moreau
Datum Moreau
Datum Moreau
Datum Moreau
Datum Moreau
Datum Moreau
Datum Moreau
Datum Moreau
Datum Moreau
Datum Moreau
Datum Moreau
Chart Visualson
Chart Visualson
Chart Visualson
Chart Visualson
Chart Visualson
Chart Visualson
Chart Visualson
Chart Visualson
Chart Visualson
Chart Visualson
Chart Visualson
Chart Visualson
Chart Visualson
Chart Visualson
Chart Visualson
Chart Visualson
Chart Visualson
Chart Visualson
Chart Visualson
Chart Visualson
Priya Databend
Hex Malachite
Nyx Datacenter
Isobar Stitch
Kolam Circuit
Glitch Nullström
Glitch Nullström
Luna Voss
Luna Voss
Isobar Stitch
Isobar Stitch
Kai Weber
Priya Databend
Tomás Lindgren
Priya Databend
Priya Databend
Priya Databend
Priya Databend
Priya Databend
Priya Databend
Priya Databend
Priya Databend
Priya Databend
Priya Databend
Priya Databend
Priya Databend
Priya Databend
Load More
Refine with AI